


Authors:
Andrew Yang

Contributor: Andrew S. Yang
Curator/Editor: Nia Easley

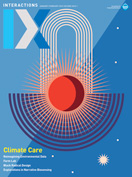
Visualizing data in ways that not only assist interpretation for experts, but also enhance communication to a general audience is no simple task. Show Your Stripes (SYS; https://showyourstripes.info/) is a project by climate scientist Ed Hawkins aimed at bringing broader awareness to anthropogenic global warming by turning historical temperature data into a visual icon. Each strip represents the planet's temperature deviation in that year from an average—blues are relatively cooler years and reds warmer ones. Those deviations trend redder and redder (warmer and warmer) from the left-most stripe (1850) to the last stripe on the right (2018).
But convention can fail in unconventional times: With all years are weighted as equal stripes, the urgent experience of living through the ever-hotter end is visually neutralized. This remix, presented as a 16-foot wall graphic in knowledges at the Spencer Museum of Art, takes the original SYS graphic and transforms it into a 3D volume. It remains true to the data—each year an equal volume—while also providing a more meaningful perspective on "now." If the graphic is meant to present a point of view, then an end-on volumetric perspective provides just that, with the visual footprint of the most recent year taking up the most visual space—just as the urgency of global warming demands. In communicating vital facts, we must move beyond convention so that we represent both data and concerns with the clarity that they deserve.
Copyright held by author
The Digital Library is published by the Association for Computing Machinery. Copyright © 2022 ACM, Inc.


Post Comment
No Comments Found