Authors:
Deepthi Raghunandan, Niklas Elmqvist, Leilani Battle
Data science is often mercurial, exploratory, and highly iterative [1]. Given a panoply of techniques for analyzing complex datasets, one can easily lose track of the code, output tables/visualizations, and notes associated with a data analysis session. More importantly, it can be difficult to remember why the results of a particular session were important and how they were derived. Online platforms such as JupyterLab, RStudio, and Observable tackle this problem in part by enabling users to store these different artifacts (code, outputs, notes) in one place: a computational notebook. In this way, notebook users do not have to wonder where their code or visualizations went; it's all contained in one notebook.
Computational notebooks are especially interesting as living documents for scientific inquiry. Notebooks naturally evolve over time as their authors discover more about the data they analyze. The process of refining a data science notebook can be just as important as the notebook itself, given that the author makes many critical decisions through their edits [2], such as what data attributes to emphasize in their analysis, what relationships between the data are most meaningful, and how these relationships could be leveraged in downstream machine-learning models.
In this way, refining a data science notebook is as much about communication as it is about deriving data insights, even when the only person you communicate with is yourself. This process is like that of a painter honing their craft. A painter could paint only for themselves, but if they want to become a better artist, they must reflect on their technique and consider how they can improve. If a solo painter fails to remember the choices they made and their significance, then the painter's ability to make better choices in the future, and thus produce better paintings, may be limited.
How might we track our progress? One possibility is to take snapshots of paintings as they develop. We can write notes to remind ourselves why we photographed a painting at a particular time, including our impressions of the techniques and materials we used. However, if we make a mistake, it's impossible to revert back to a photograph. Our only choice is to continue with our flawed painting. Another possibility is to paint multiple copies of the same piece in tandem, keeping the paintings identical until we want to try something new. If we dislike the results, we can abandon that copy and proceed with the others, with the added benefit of being able to write notes about what we disliked about this particular copy so we don't forget.
In our research studying data science workflows [3], we observed that some analysts do something similar to our painting scenario but with computational notebooks. Specifically, we see thousands of users saving versions of their Jupyter notebooks using code versioning software such as Git. Users can save specific versions of their notebooks as separate records in Git, enabling them to revert to a previous milestone as needed by rolling the notebook back to the corresponding Git record. But unlike paintings, computational notebooks are digital, making it easy to generate new copies as desired. Git was designed, however, to track changes to code, not user insights. Data science is not always—and arguably, rarely—about the code. How do analysts adapt this software to track and reflect on their process of insight discovery? Furthermore, could we quantify how data science evolves over time by analyzing these digital snapshots? For example, do analysts always start with exploration—searching the data for something interesting by writing lots of code and seeing what "sticks"—and end with explanation—presenting their findings and reasoning process to colleagues through text and visualizations?
Computational notebooks are especially interesting as living documents for scientific inquiry.
To answer these questions, we downloaded 60,000 Jupyter notebooks from GitHub, an online platform for sharing Git repositories. Then we filtered the corpus for notebooks that seemed to be used for data science purposes. From our collection of 2,575 data science notebooks we randomly sampled 244 notebooks to analyze by hand. Specifically, we wanted to see whether we could distinguish between exploratory notebooks and explanatory ones. We found that exploratory notebooks deal more with experimentation and usually contain more code. Explanatory notebooks deal more with telling the stories behind the code and thus tend to contain more code comments and textual notes. These findings align with previous definitions of exploratory and explanatory notebooks from the literature [4].
However, this manual approach does not scale beyond a couple hundred notebooks. To enable scale-up, we encoded our observations into a more rigorous definition of exploration versus explanation that a regression model or machine-learning model could learn. We annotated each sampled notebook with score ranges between 0.1 and 1.0, representing whether the notebook appeared to be more exploratory (0.1), explanatory (1.0), or somewhere in between. Then we calculated low-level features that could predict our scores, such as the number of code cells within the notebook or the number of spaces and newline characters. We observed a significant linear correlation between these features and our exploration-explanation score (Figure 1), suggesting these features were a reasonable starting point for predicting a notebook's position along this exploration-explanation spectrum.
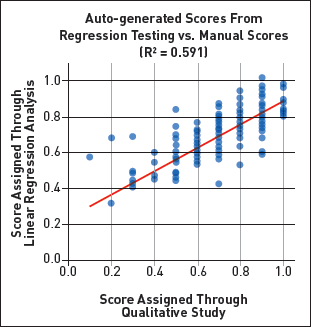 | Figure 1. We manually scored computational notebooks according to how exploratory (0.1) or explanatory (1.0) they are and trained a linear regression model to predict these scores. |
To understand how data science notebooks evolve over time, we trained a linear regression model on our exploration-explanation scores and calculated features. We used this model to generate a score for every observed Git record associated with our 244-notebook sample. For example, if a user saved their notebook five times in Git, we used our model to generate a separate score for each version, producing five scores for this notebook. We plotted a regression line for each notebook to see how its exploration-explanation score shifted over time; for example, whether the score went up (positive regression slope), went down (negative slope), or stayed the same (neutral slope). We also observed whether the score started out exploratory, or with a low score, or started out explanatory, or with a high score. This produced four possible groupings of notebook shifts (Figure 2). Prior research suggests that notebooks should fall primarily in the exploratory-explanatory group [4,5]. However, we found a significant fraction of notebooks within every group, suggesting that notebooks may evolve in ways researchers did not anticipate.
 | Figure 2. We grouped notebooks according to whether they started exploratory or explanatory and how their score increased or decreased over time, producing four distinct groups. |
These findings could lead to future improvements in notebook platforms. For example, if Jupyter could detect when a user is in an exploratory analysis phase, Jupyter plug-ins or even Python code snippets could be recommended to facilitate their exploration [6]. Our work also corroborates existing hypotheses that users' sensemaking processes can be inferred from the notebooks themselves [1,4], revealing an unforeseen window into human cognition. Put another way: Analyzing code changes within computational notebooks can yield insight into people's analytical reasoning; in essence, computer code becomes a representation of thought, which we plan to explore in the future.
1. Kery, M.B., Radensky, M., Arya, M., John, B.E., and Myers, B.A. The story in the notebook: Exploratory data science using a literate programming tool. Proc. of the 2018 CHI Conference on Human Factors in Computing Systems. ACM, New York, 2018, 1–11.
2. Kery, M.B., John, B.E., O'Flaherty, P., Horvath, A., and Myers, B.A. Towards effective foraging by data scientists to find past analysis choices. Proc. of the 2019 CHI Conference on Human Factors in Computing Systems. ACM, New York, 2019, 1–13.
3. Raghunandan, D., Roy, A., Shi, S., Elmqvist, N., and Battle, L. Code code evolution: Understanding how people change data science notebooks over time. arXiv preprint arXiv:2209.02851, 2022; https://arxiv.org/abs/2209.02851
4. Rule, A., Tabard, A., and Hollan, J.D. Exploration and explanation in computational notebooks. Proc. of the 2018 CHI Conference on Human Factors in Computing Systems. ACM, New York, 2018, 1–12.
5. Pirolli, P. and Card, S. The sensemaking process and leverage points for analyst technology as identified through cognitive task analysis. Proc. of International Conference on Intelligence Analysis 5 (2005), 2–4.
6. Raghunandan, D., Cui, Z., Krishnan, K., Tirfe, S., Shi, S., Shrestha, T.D., Battle, L., and Elmqvist, N. Lodestar: Supporting independent learning and rapid experimentation through data-driven analysis recommendations. Proc. of VDS 2021. ACM/IEEE, 2021.
Deepthi Raghunandan is a Ph.D. candidate at University of Maryland, College Park working with Niklas Elmqvist and Leilani Battle. Inspired by her experiences at Microsoft, she aspires to build flexible and smart data analysis systems. She's currently contributing her ideas to a team of computational scientists at NASA Goddard. [email protected]
Niklas Elmqvist is a professor of information studies and computer science at the University of Maryland, College Park. His work is in data visualization, human-computer interaction, and augmented/mixed reality. He is the former director of the HCIL at UMD. [email protected]
Leilani Battle is an assistant professor in the Allen School at the University of Washington. Her research focus is on developing interactive data-intensive systems that aid analysts in performing complex data exploration and analysis. She holds an M.S. and a Ph.D. in computer science from MIT and a B.S. in computer engineering from UW. [email protected]
Copyright held by authors
The Digital Library is published by the Association for Computing Machinery. Copyright © 2023 ACM, Inc.






Post Comment
No Comments Found