

Authors: Lauren Chapman Ruiz
Posted: Wed, September 10, 2014 - 1:01:14
This article was co-written by Izac Ross, Lauren Chapman Ruiz, and Shahrzad Samadzadeh.
Recently, we introduced you to the core concepts of service design, a powerful approach that examines complex interactions between people and their service experiences. With this post, we examine one of the primary tools of service design: the service blueprint.
Today’s products and services are delivered through systems of touchpoints that cross channels and blend both digital and human interactions. The service blueprint is a diagram that allows designers to look beyond the product and pixels to examine the systems that bring a customer’s experience to life.
What is a service blueprint?
You may be familiar with customer journey mapping, which is a tool that allows stakeholders to better understand customer interactions with their product or service over time. The service blueprint contains the customer journey as well as all of the interactions that make that journey possible.
Because of this, service blueprints can be used to better deliver a successful customer experience. Think of it this way: You can look at a building, and you can read a description, but to build the building you need more than an image or description. You need the instructions—the blueprint.
Service blueprints expose and involve many of the core concepts we talked about in Service Design 101.To use that vocabulary: Service blueprints clarify the interactions between service users, digital touchpoints, and service employees, including the frontstage activities that impact the customer directly and the backstage activities that the customer does not see.
When should you use a service blueprint?
Service blueprints are useful when:
- You want to improve your service offering. Knowing how your service gets produced is essential for addressing breakdowns or pain points.
- You want to design a new service that mixes digital and non-digital touchpoints. Service blueprints shine when examining and implementing the delivery of complex services.
- You have lost track of how the service gets produced. Services, like products, have manufacturing lines. The longer the service has been around or the larger the organization, the more siloed and opaque the manufacturing process can become.
- There are many players in the service. Even the most simple-sounding service often involves IT systems, people, props, and partners all working to deliver the customer experience. A blueprint can help coordinate this complexity.
- You are designing a service or product that is involved in producing other services. Products and services often interact with other services, particularly if they are b2b. Understanding your customer’s interactions with partners throughout the service can support a more seamless—and better—customer experience.
- You want to formalize a high-touch service into a lower-touch form. New technologies can create opportunities for delivering higher-touch (and thus more expensive) services to broader audiences in new, more cost-effective forms. For example, think about the expanding world of online education. A blueprint uncovers the essential considerations for implementing a new, lower-touch service.
Keep in mind that there are times when a service blueprint is not the right tool! For example, if the goal is to design an all-digital service, journey mapping or process flows might be more appropriate.
Anatomy of a service blueprint

You understand the concept of service blueprints, and you know when to use them. Now, how do you make one? The starting elements are simple: dividing lines and swimlanes of information.
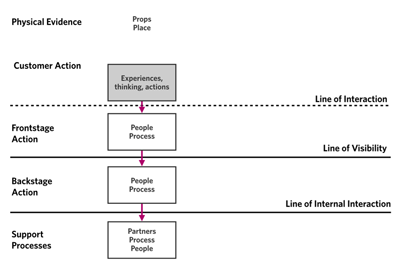
There are three essential requirements for a formal service blueprint:
- The line of interaction: This is the point at which customers and the service interact.
- The line of visibility: Beyond this line, the customer can no longer see into the service.
- The line of internal interaction: This is where the business itself stops, and partners step in.
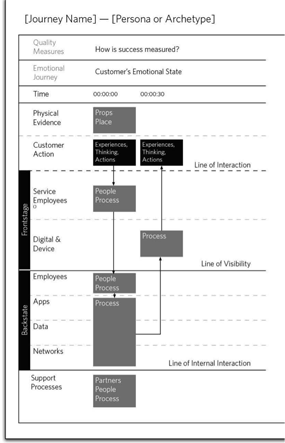
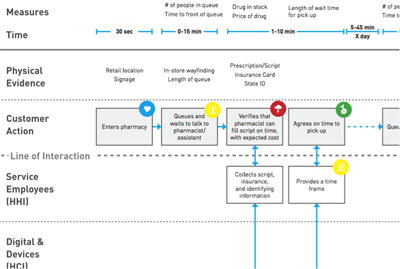
In between these lines are five main swimlanes that capture the building blocks of the service:
- Physical evidence: These are the props and places that are encountered along the customer’s service journey. It’s a common misconception that this lane is reserved for only customer-facing physical evidence, but any forms, products, signage, or physical locations used by or seen by the customer or internal employees can and should be represented here.
- Customer actions: These are the things the customer has to do to access the service. Without the customer’s actions, there is no service at all!
- Frontstage: All of the activities, people, and physical evidence that the customer can see while going through the service journey.
- Backstage: This is all of the things required to produce the service that the customer does not see.
- Support processes: Documented below the line of interaction, these are the actions that support the service.
Additional Lanes
For clarity, here are some additional swimlanes we recommend:
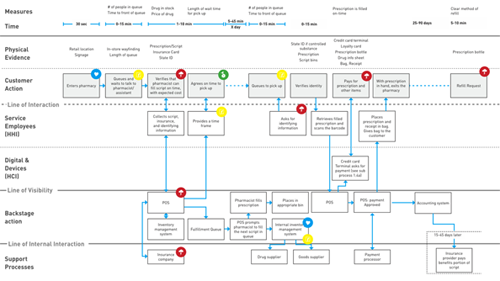
- Time: Services are delivered over time, and a step in the blueprint may take 5 seconds or 5 minutes. Adding time along the top provides a better understanding of the service.
- Quality measures: These are the experience factors that measure your success or value, the critical moments when the service succeeds or fails in the mind of the service user. For example, what’s the wait time?
- Emotional journey: Depending on the service, it can be essential to understand the service user’s emotional state. For example, fear in an emergency room is an important consideration.
- Splitting up the front stage: With multiple touchpoints that are working together simultaneously to create the service experience, splitting each touchpoint into a separate lane (for example, digital and device interactions vs. service employee interactions) can be very helpful.
- Splitting up the backstage: The backstage can be comprised of people, systems, and even equipment. For detail or low altitude blueprints, splitting out lanes for employees, apps, data, and infrastructure can clarify the various domains of the service.
- Phases of the service experience cycle: Services unfold over time, so it can add clarity to call out the phases of the experience cycle. For example: how customers are enticed to use the service, enter or onboard to the service, experience the service, exit, and then potentially re-enter the service and are thus retained as customers.
- Photos/sketches of major interactions: Adding this lane can help viewers quickly grasp how the service unfolds over time, in a comic-book-like view.
You can build as much complexity as needed into your blueprint, depending on the complexity of the service.
The 5 Ps and how they relate to the blueprint
In Service Design 101, we talked about the 5 Ps: People, Processes, Props, Partners, and Place. Looking at the service blueprint structure, you can see that all of the 5 Ps are captured. Through the top are Props and Place, and down through the rest of the blueprint are People, Process, and then Partners in the support processes. In the Customer Action lane are experience and actions.
Service blueprints can only be useful if they can be interpreted and implemented. We recommend the following common notation standards for making sure a blueprint is clear, focused, and communicates successfully.
Variations
Like a customer journey map, a service blueprint is focused on one persona’s experience through a single path. Think of it as a kind of scenario. Your blueprint will quickly become too complex and too difficult to read if you put multiple journeys on a single one, or try to capture service use with many variations. Blueprints show one use case or path over time, so additional blueprints must be used for variations of the service journey.
Common notations
Arrows
When an arrow crosses a swimlane, value is being exchanged through the touchpoints of the service.
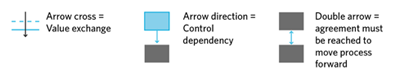
Arrows have a very important meaning beyond the direction of the value exchange. They indicate who or what system is in control at any given moment:
- A single arrow means that the source of the arrow is in control in the value exchange.
- A double arrow indicates that an agreement must be reached between the two entities to move the process forward. For example, agreeing on the pick-up time with a pharmacist, or negotiating a price in a non-fixed cost structure.
Annotations
As you do the research and field observations necessary to build a blueprint, remember that blueprints can be a powerful way to communicate what’s working and what isn’t working for both service users and employees in the existing process. These notable moments can be captured in a number of ways, but we recommend icons with a legend to keep things legible and clear.
Some notable moments to consider capturing:
- Pain points which should be fixed or improved
- Opportunities to measure the quality of the service
- Opportunities for cost savings or increased profits
- Moments that are loved by the customer and should not be lost
What’s next?
As you begin to incorporate blueprinting into your process, remember that blueprints have altitude! They can capture incredible amounts of detail or summarize high-level understandings. When evaluating or implementing an existing set of service interactions, a low altitude map that details out the processes across touchpoints and systems is an invaluable management tool. To quickly understand the customer experience in order to propose design changes or develop a shared understanding, higher altitude diagrams can be most helpful.
Service blueprints break down the individual steps that are happening to produce the customer experience, and are an essential tool for the practice of service design.
In upcoming weeks we will talk about where this tool fits into the design process, and on gathering information to create service blueprints and journey maps.
Posted in: on Wed, September 10, 2014 - 1:01:14
Lauren Chapman Ruiz

View All Lauren Chapman Ruiz's Posts


Post Comment
@Raffaele (2014 09 21)
What do you think of my storygraph? http://www.rainwiz.com/2012/10/13/introducing-the-storygraph/
@Kathryn Gallagher (2015 01 13)
Thank you Lauren for the great explanation. I would like to create electronic service blueprints myself and wondered if you had any software apps. you could recommend, pref. free? (I’m a student) Thank you!
@Vic (2024 07 09)
If you put various journeys on a single blueprint or attempt to capture service use with numerous variants, your blueprint will quickly become too complicated and challenging to comprehend. See: gutter replacement
@google (2024 11 28)
Entdecken Sie bei PowerSmart zuverlässige hp laptop akku sowie akku für dyson v8.
@botoes (2025 04 28)
Very imporant to have a blueprint to define what are the goals and objectives. Botões
@Wacky Flip (2025 07 17)
Wacky Flip is the ultimate test of your reflexes—flip, twist, and bounce your way to victory!
@Mayarivers (2025 10 13)
In Infinite Craft Recipes, you’re the creator. Each fusion brings something unique, whether it’s an object, a creature, or an idea. What will you craft today?