Authors:
Neven ElSayed, Eduardo Veas, Dieter Schmalstieg
With the emergence of digital sensor platforms and infrastructures, we are seeing a massive increase in the amount of data being gathered from objects, processes, and spaces. For example, social media interactions, data collected from IoT devices, financial transactions, transportation-related data, governmental records, and scientific datasets all make substantial contributions to the expanding pool of data sources.
To be made available for personalized, effective, timely, and responsive services, this growing volume of data needs to be fielded, sorted, and rendered accessible, anytime and anywhere. This will allow users to interact with adaptive physical objects, spaces, and their associated data [1]. Recently, immersive [2] and situated analytics [3] have been introduced to expand the visual analytical space using virtual and augmented reality technologies. These technologies build analytics on the user's capacity to move between different environments and scenarios in the physical world. However, a critical challenge arises when deploying analytics in linked query sessions that are connected to different virtual or physical worlds. In these cases, users need to switch between dynamic display spaces, various interaction modalities, and fragmented analytics sessions.
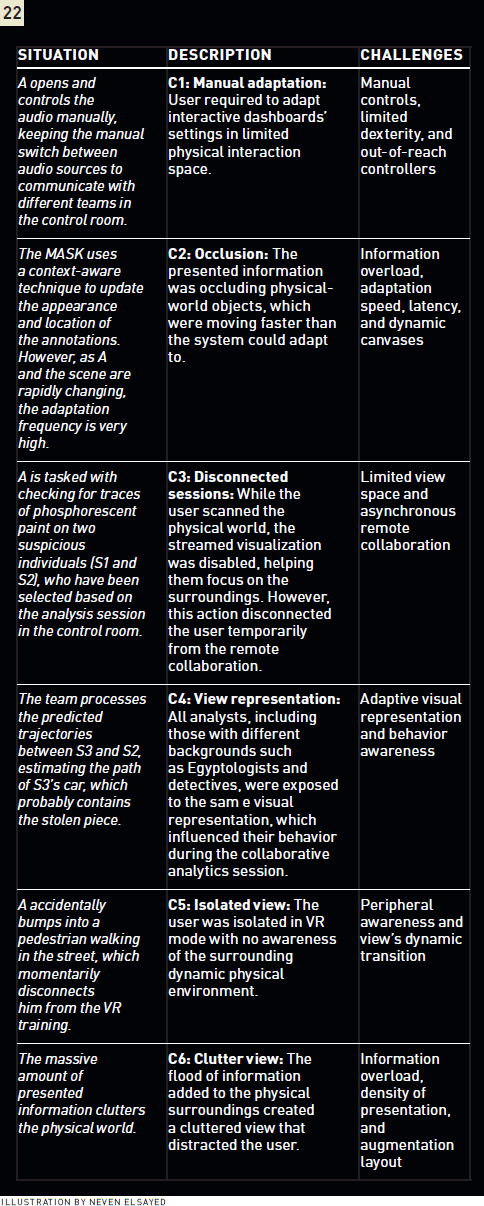
The emerging field of mobile analytics advocates the immediacy of adapted situated analytics based on knowledge of the surrounding environment. To showcase the challenges (C1–C6 below) and research directions (RD1–RD6 below), we present an illustrated use case for immersive and situated analytics, highlighting the technology limitations that prevent the deployment of analytics in different environments. Examples that we illustrate include: 1) illumination, 2) clutter, 3) static vs. dynamics of multiple objects in motion, 4) close-up views, 5) wide-open views, and 6) first-person motion. These aspects make it challenging to deploy arbitrary mixed reality techniques in real-life connected scenarios.
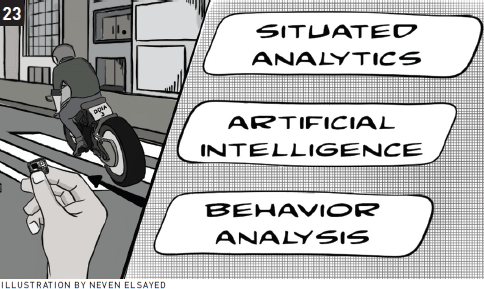
Our illustration, which takes the form of a speculative design scenario, presents a vision that merges situated analytics with artificial intelligence and behavior analysis to empower analytics on the go. Mobile analytics supports instant data analysis, while augmented reality seamlessly blends information into the surrounding physical environment. We illustrate the techniques and methods that, along with AI, are needed to offer a fully immersive experience, providing a cohesive, personalized presentation for mobile analytics.
 | It all begins when an important piece is stolen from a museum. Detectives need to solve the case quickly and accurately, as any incorrect analysis path could lead to the piece being permanently lost. It's a typical visual analytics case, where detectives need to analyze different datasets using diverse models (AI engines), supported by visual representations [4]. |
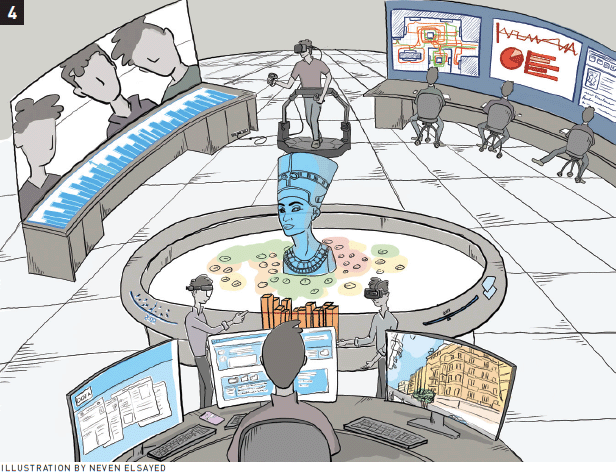
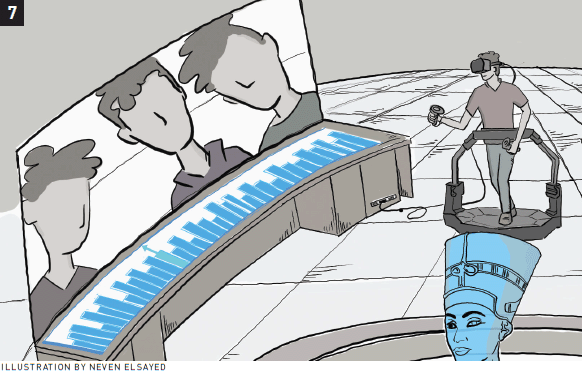
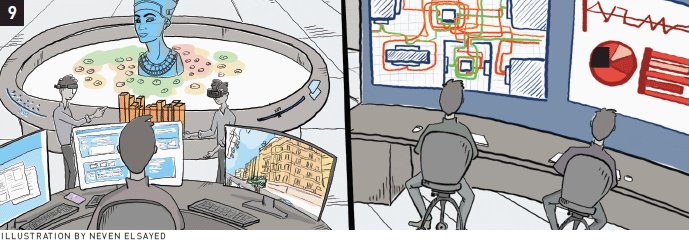
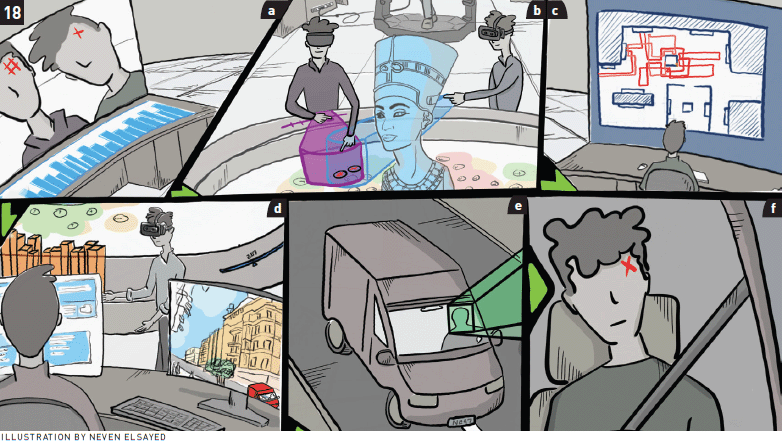
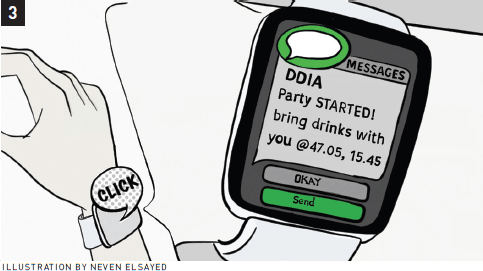 | The case is assigned to the Digital Detective Intelligence Agency (DDIA). The team gathers in the main control room, equipped with the most advanced immersive analytics tools. |
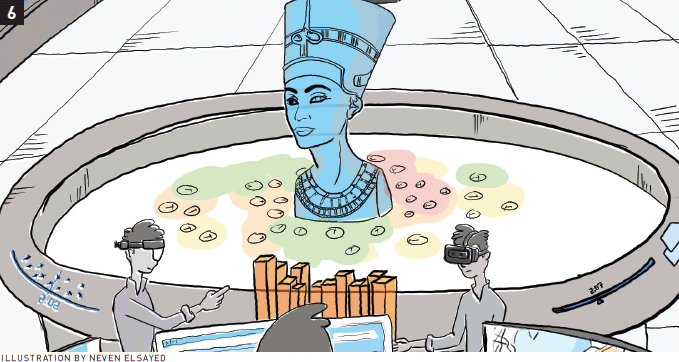
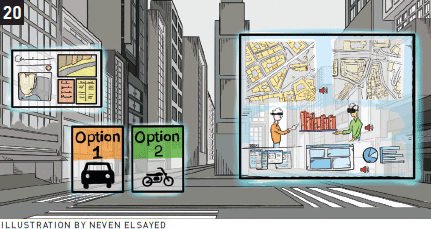
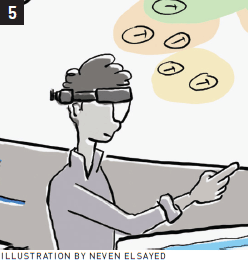 | An agent touches the surface with a finger, drawing a shape that encircles several data points, then grabs and drops them in midair between him and his collaborator. |
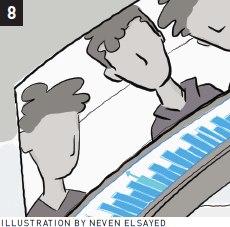 | The interface allows the Gwish to navigate forward and backward through time. With the advantage of infinite locomotion, the Gwish can explore the museum like an ordinary visitor at the time of the crime. |
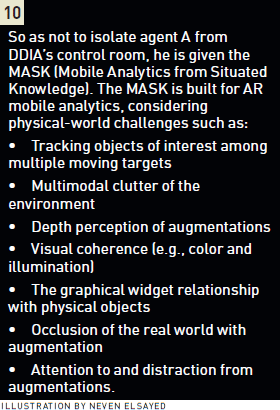
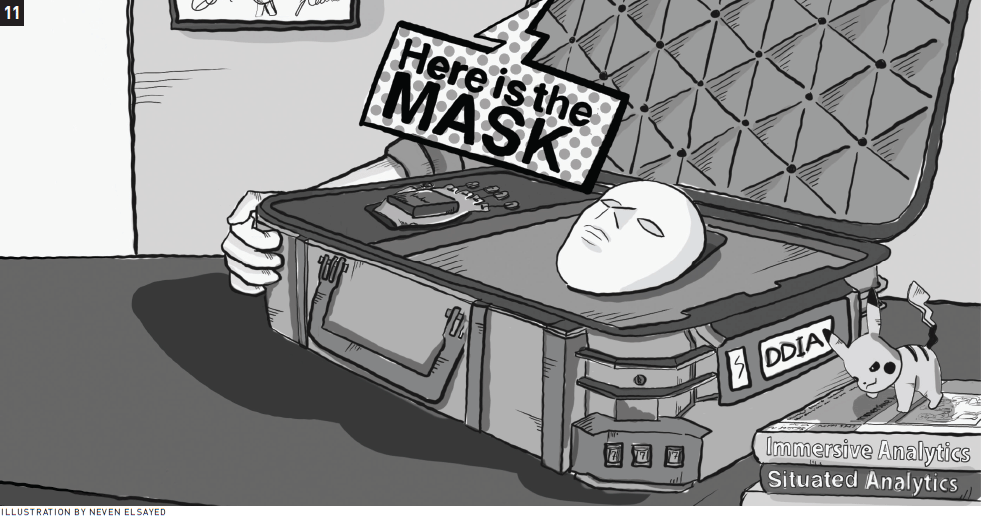
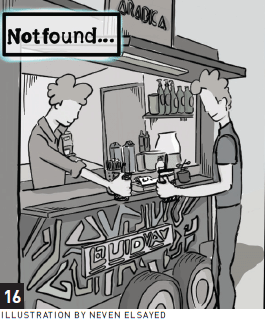
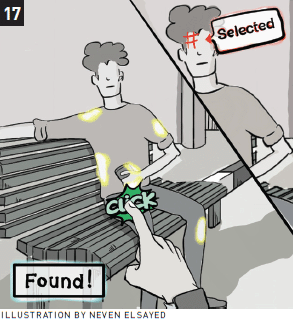
 | Agent A puts on and then calibrates the MASK. The MASK has eye tracking and connects to haptic gloves. The eye-tracking controls the presented content based on A's performance and is used for gaze interaction. The haptic gloves provide vibration, thermal, and kinesthetic feedback and track A's hands. As the actuators and sensors drain the gloves' power, the actuators are disabled and can be activated manually if needed. The MASK supports data analyses in immersive environments: virtual reality (immersive analytics) [2] and augmented reality (situated analytics) [3]. With a hand gesture, A initiates the mission on the MASK. The accurate tracking supported by the gloves enables A to carry out the interactions in secret. DDIA asks A to collect data on two suspicious visitors from the field that cannot be collected digitally. |
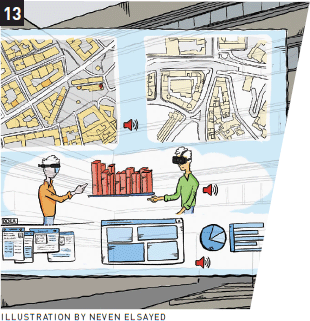
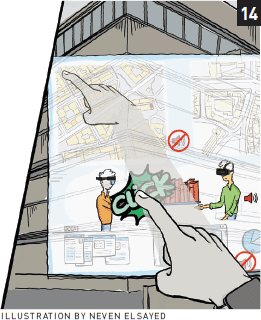 | Agent A uses midair interaction with the presented content. To keep the interaction inconspicuous, A can reach far-off sections with gaze and glove interactions. The MASK supports A with a hand avatar, enhancing the near-field interaction. Audio streaming from the DDIA control room uses spatial sound localization. DDIA headquarters is busy, however, which produces a cluttered audio environment and disrupts the automatic sound localization. A opens and controls the audio manually, switching between audio sources to communicate with different teams in the control room. |
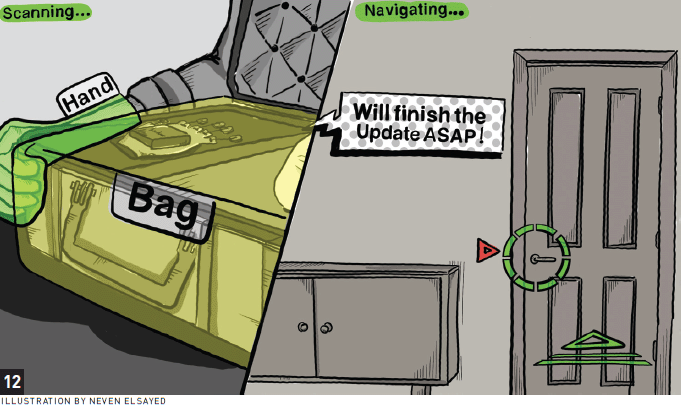
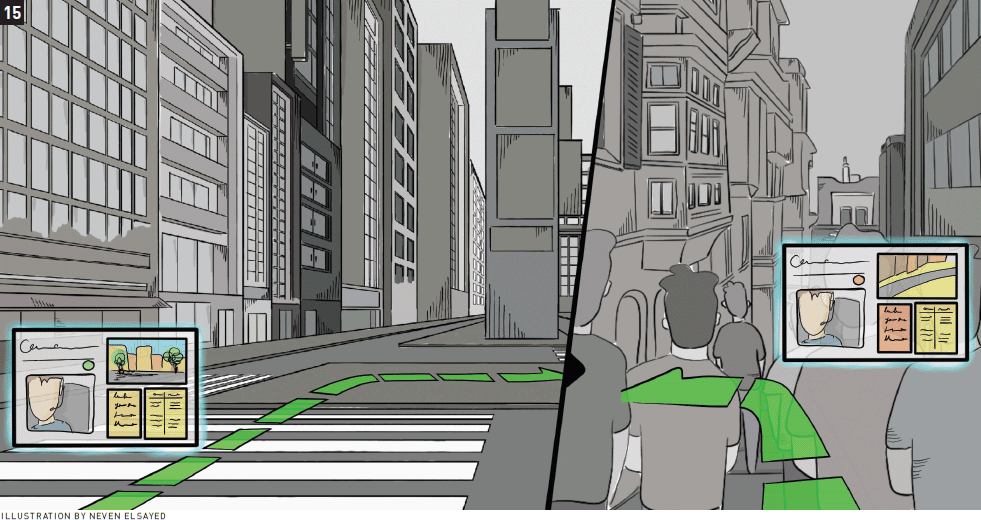
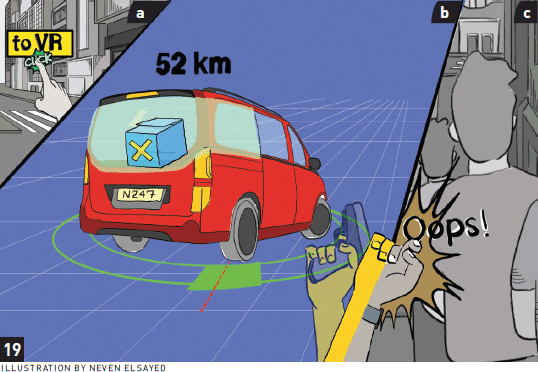
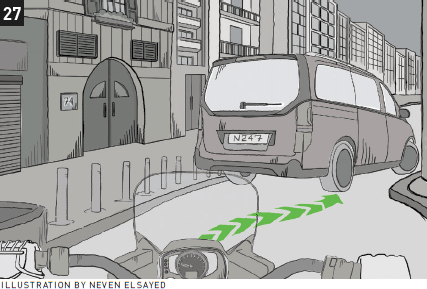
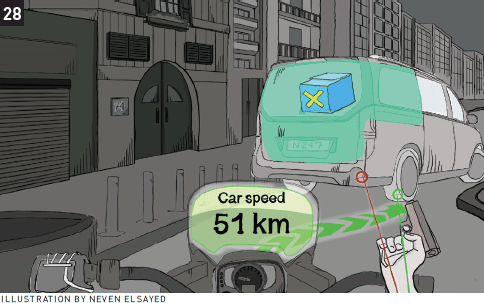 | Based on the physics-engine calculation, the MASK augments the optimal shooting trajectory as lines situated to A's hand, to reduce the rendering cost. |
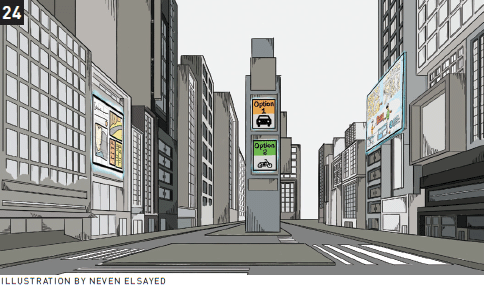
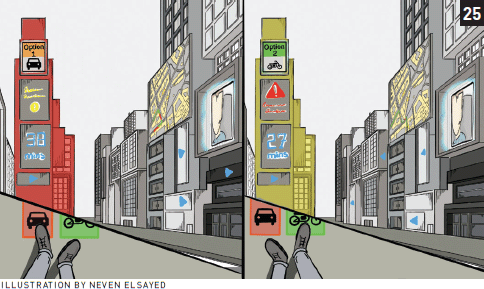
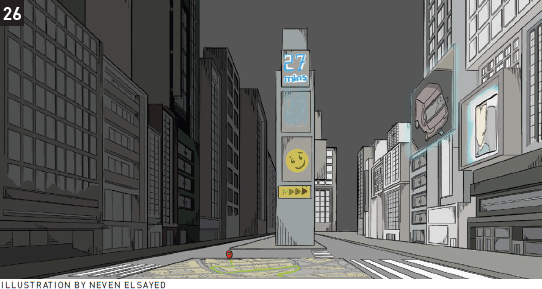
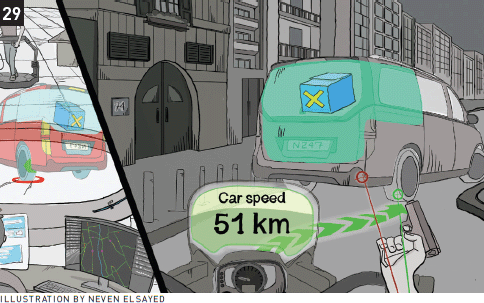 | In the meantime, one of the DDIA team members is manipulating traffic to slow down the suspicious car. A is streaming the live scene using the MASK's camera, combined with eye tracking. |
The presented storyline provides a comprehensive look at the combination of mixed reality and visual analytics for mobile analytics, emphasizing the immediacy requirements for information on the go. We advocate the need for a fully immersive experience that considers both the real-world situation and the abstract information, with artificial intelligence generating a cohesive personalized presentation of real and virtual worlds. Various paradigms for the access and analysis of digital information have been put forth: visualization [5], visual analytics [4], augmented reality [1], immersive analytics [2], situated analytics [3], and embedded data representations [6]. Mobile analytics implies an on-the-go analysis, while augmented reality seamlessly blends information into the surrounding physical environment. We draw from the body of literature the techniques and methods needed to offer a fully immersive experience, with AI generating a cohesive, personalized presentation of real and virtual. The storyline highlights the existing visualization, interaction, and analysis for mobile analytics, and its potential research directions (RD), which can be summarized as follows:
RD1. Adaptive UI blended interface based on user behavior: by blending the augmented visualization into the physical environment, enabling the system to manipulate the view based on situated knowledge (e.g., object tracking, depth, and clutter factor).
RD2. Adaptive embodied interaction: by dynamically changing its interaction mode based on the user's behavior and surrounding knowledge.
RD3. Blended visualization for perception enhancement: by employing scene-manipulation techniques to control users' attention. These models can be automatically adapted based on situated knowledge, including factors like clutter percentage, depth, and illumination.
RD4. Visual cues for dynamic situation augmentation: by utilizing predefined static models to adapt the situated visualization for fast animation, leveraging behavioral knowledge of the users' status.
RD5. Task-driven analytic interface: by adapting the situated visualization and adjusting the interaction tool based on predefined task goals.
RD6. Collaborative mobile analytics: by dynamically adapting the visual analytics session for each user independently, based on users' behavioral knowledge.
In this article we introduced, reviewed, and illustrated various parameters affecting mobile analytics in the wild. Through our illustrative scenario, we presented the challenges and requirements for deploying mobile analytics in real-life scenarios. We envision the impact of adapting visual (situated and immersive) analytics when considering situated knowledge and an AI user interface. Situated knowledge includes the physical environment's parameters, the analytics' tasks, and the user's behavioral data. AI engines use the collected parameters for generative models, calculating the augmentation settings and control models.
1. Kruijff, E., Swan, J.E., and Feiner, S. Perceptual issues in augmented reality revisited. IEEE International Symposium on Mixed and Augmented Reality. IEEE, 2010, 3–12; https://doi.org/10.1109/ISMAR.2010.5643530
2. Chandler, T. et al. Immersive analytics. Big Data Visual Analytics (BDVA). IEEE, 2015, 1–8; https://doi.org/10.1109/BDVA.2015.7314296
3. ElSayed, N.A.M.,Thomas, B.H., Marriott, K., Piantadosi, J., and Smith, R.T. Situated analytics: Demonstrating immersive analytical tools with augmented reality. Journal of Visual Languages and Computing 36 (Oct. 2016), 13–23; https://doi.org/10.1016/j.jvlc.2016.07.006
4. Keim, D. Andrienko, G., Fekete, J-D., Gorg, C., Kohlhammer, J., and Melançon, G. Visual analytics: Definition, process, and challenges. Lecture Notes in Computer Science 4950 (2008), 154–176.
5. Shneiderman, B. The eyes have it: A task by data type taxonomy for information visualizations. Proc. of 1996 IEEE Symposium on Visual Languages. IEEE, 1996, 336–343.
6. ElSayed, N.A.M., Smith, R.T., Marriott, K., and Thomas, B.H. Blended UI controls for situated analytics, 2016 Big Data Visual Analytics (BDVA). IEEE, 2016, 1–8; https://doi.org/10.1109/BDVA.2016.7787043
Neven ElSayed, a senior researcher at the Know Center in Graz, has specialized in augmented reality (AR) and visual analytics (VA) since 2010. ElSayed introduced "situated analytics" as a novel merging between AR and VA, earning a Ph.D. in computer science from the University of South Australia in 2017 and receiving the Michael Miller Medal for an outstanding thesis in the same year. [email protected]
Eduardo Veas is a professor of intelligent and adaptive user interfaces at the Institute of Interactive Systems and Data Science at Graz University of Technology. He is also area manager of the Human-AI Interaction group at Know Center GmbH. He has a Ph.D. in computer science from Graz University of Technology and a master's in information science and technology from Osaka University in Japan. [email protected]
Dieter Schmalstieg is Alexander von Humboldt Professor of Visual Computing at the University of Stuttgart. His research interests are augmented reality, virtual reality, computer graphics, visualization, and human-computer interaction. He is a fellow of the IEEE and a member of the IEEE VGTC Virtual Reality Academy. [email protected]
Copyright 2023 held by owners/authors
The Digital Library is published by the Association for Computing Machinery. Copyright © 2024 ACM, Inc.







Post Comment
No Comments Found